A prime year for “Us”…and with only odd digits in ascending order

September 19, 2018

A year ago, it seems that I was pretty frustrated. And come to think of it, I have my frustrations now, but they are quite different. After listening to this year’s Kol Hadash Rosh Hashana evening sermon [MP3], I can see more clearly that my worries last year were very much “Me”, and this year’s are a bit more “We”. But, to summarize the sermon bluntly, AND(ME,WE) > OR(ME,WE).

Last year I wrote about how oppressed I felt by a number.

This year, we made ceremony come alive through music and memory, filling our home with the smells of our seudah hamafseket, “separation meal”, and the words of Itzak Perlman.

This year, we remembered our ancestors–the words they have said and the people who are gone–together over light, and drink, and food.

This year, we made an aspirational Ashamnu acrostic together as a family.

This year, we made an inspired playlist to share new and old words about forgiveness, confession, and other High Holiday staples.

And this year, I still looked in the weirdest places to find strange or new meaning for an arbitrary cut in time.  And found a beautiful one much closer than I expected.

There is still so much work to do, and still so much to be mad about. But this anno mundi year is a year where I can work on “Me” as well as “We”.

G’mar Hatima Tova.

IMG_20180918_204810

Our aspirational Ashamnu for 5779 Anno Mundi.  May this year be a year of Action, Bravery, Calm, Dance, Exercise, Fun, Gratitude, Harvest, Inquiry, Joining In, Kickass Naps, Letters, Music, Nurturing, Organization, Practice, Quiet, Rest, Sleepovers, Thoughtfulness, Us, Vulnerability, Writing, X-rays, Yoga, and Zeal.

Calendrical Hegemony

September 21, 2017

It’s another new year somewhere, this time in the hearts and minds of Jewish people. As Jews are wont to do, I am debating and questioning what Judaism even means.  To me, this day in age, in this economy.

According to 23andMe, I am comprised of even more Ashkenazi DNA than either of my parents, somewhere between 98.3% and 99.5%.  So I’m of a heritage that has been oppressed and the oppressor, in old and in new days.  I delight and recoil from various traditions, sometimes at the same one, and seek a place for myself that reconciles my heritage with the brand of anti-racist, pro-indigenous, feminist, decolonial thought that I’m trying to cultivate within myself and in my family.

So I like that I don’t have to count time from when Jesus may have been born, but when my imperfect mind still chooses first to proffer Homer or Virgil or Maimonides or Dante or Milton or Dostoevsky or Primo Levi, you can see that I could do better.

A convenient dehegemonization of Anno Domini is to add 10,000 years and enter the Human Era when we claim to have found adults who probably could hack it in today’s civilizations if they were transplants here.  But this isn’t “true” and correlates with narrow adoption.

We could count from when humans first left the planet to touch other soil, in which case we’d now be in the 49th year After Tranquility.  But the full proposal to honor 14 white men (and an Egyptian that white people think was white?) centered on extraterrestrial colonization and terrestrial war mongering could also do better.  Much better.

My people have counted from their creation story’s beginning.  Which is kind of like trying to piece together what happened after a long night of drinking where only parts of the evening–transpired in crystal clarity–are strung together by less-aimed walks and tumbles of lesser-known duration.  Surely in hindsight we can assign meaning to the ambling, and guesses to the meaning, and then more meaning to the guesses, but we can’t forget what estimation techniques were used and how to correctly propagate errors.  To be frank, my college physics lab teachers _could_ probably be more proud but I’ll invoke them here nonetheless.

So we may be off by 1700 years.  Or by 4.5 billion years. Or 4.6.  Or 13.8 billion why not.

There’s so much more to be mad about, and–on this day–so much more to be doing, but I’ll just catalog this first day of this new year through my own kind of gematria, albeit based a bit more in number theory and trivia.

More importantly, this anno mundi year is a year where I can do better, and I hope I can.

Shana Tova.  Anyada Buena, Dulse i Alegre.  Gut Yontif un Gut Yor.

IMG_20170920_191005

Storytelling

April 2, 2017

There are so many stories to hear–to study–and there are so many more to tell.  The story of the distance between these words and my last will be saved for another time.  Suffice it to say, things have been chaotic, I’ve felt an inadequate cruise director for my life and some of the lives around me, I’ve bemoaned calendrical hegemony, I’ve lost matrix pseudospectra in my daily life, I’ve done the horribly terrifying thing of sneezing while driving, I’ve tried to live while parenting and parent while living, and I’ve been trying to or at least learning about trying to dismantle my privilege.

But recently I’ve been entranced by some very interesting stories, and I need to elevate them out of my private consumption and study as a means to honor them, reflect on them, and move forward and find a new pace for my daily life that acknowledges the wonder of storytelling but doesn’t get as lost as I have been in them.

  • Flygirl – I started reading this during #BHM17 because my city had some great programming at our public library around this book.  Racism, colorism, feminism, #blackgirlmagic, and the struggle stripe this coming of age tale.
  • Shittown – A binge-able podcast brought to you by the folks over at Serial and This American Life not without controversy but a deeply resonant story nonetheless.  Lots of triggers, so I’d recommend seeing if it’s your cup of tea by reading up to (or past, if that’s your thing) the spoiler warnings at Vox,  the New York Times, and the Atlantic.
  • The Expanse – Everything that I’ve been missing since I finished watching every episode of every Star Trek franchise over 2015 and 2016.  Not Enterprise though, of course.  This embeds comprehensive Deep Space Nine galactic politics in a believable reality of our simple complex solar system with exceptional editing of any fluff or cruft.  Season 1 for free on Amazon, and while you can stream Season 2 (which has three more eps in April) on the SyFy website, I recommend paying for it on Amazon so they know you’re watching and so they can afford to make more of this absolutely marvelous show.  Only you can stop The Expanse from becoming the next cancelled Sci-Fi classic.  Also, representation matters and the cast sets a new standard for a future of diversity and inclusion by our standards here in 2017.
  • Kings of Kings – Dan Carlin’s Hardcore History is probably one of the most important things I was missing from my education: true history through broad as well as deep context.  This three-parter clocks in at just under 13 hours of content about the rise and fall of the Achaemenid Empire.  The 500 to 1000 years of events covered in this epic has everything to do with the world we live in today, since they set the stage for mono-theism and the intervening 2000 years.  Primarily, listening has given me confidence to dive down the (Wikipedia) rabbit hole into a better understanding of Passover as it nears but also recent events in the Levant.
too_many_tabs

At a certain point, Chrome stops counting how many tabs you have open.

This feels better: to confess to reading on every toilet seat, staying up too late, staring at bright screens while sitting under-babe even though they are ready to go into their crib, going on longer runs and waiting in driveways and having a single headphone in my ear while doing almost everything so that I can keep the stories coming, and watching one more ep on a lunch break that was already too long because I was listening to podcasts while prepping my food too slowly or reading books and articles while waiting for water to boil or the microwave’s beep, only to delay any reaction until getting to that next comma, period, vocal pause.  Or just one more.

Enumerating MATLAB Command Iterations

June 10, 2016

I wasn’t trying to come up with the most boring sounding title for a post, but I just couldn’t stray from the descriptivist banality of what is about to unfold.  Well, banal only to some.  Clearly not to me or Nick Higham, whose interest in mathematical peculiarities extends beyond the numerical and functional to the editorial as well.

In a recent post, he raises a curious point that certain MATLAB commands can be applied to themselves.  This is curious because the functions may or may not accept numerical or string inputs, but MATLAB’s weak-typing allows us to interpret the string input as whatever is required, in some circumstances.

For example,

>> diff diff

returns the differences between subsequent array elements, and returns

ans =
    5    -3    0

by interpreting the input as the ASCII numeric value of the string input.

Most of the trickery is of this flavor, casting string input as a numeric array and then going on our merry way.  What’s cutest is Nick Higham’s line of thinking: what about triple (and naturally, more) invocations of these functions?  How many are valid?  How many are interesting?

MATLAB has helped us pose the question and it is perfectly equipped to answer it.  With 20 lines of code to recurse the folder tree of the default MATLAB path and 10 more to run the commands we’re interested in, I have found some interesting results.  Mind you, I’m stuck in the past (2012b) so your mileage may vary.

gtext gtext

is surely the first most interesting thing, since it’s the first double-invocation that requires user interaction.  Yes, there are plenty of dialog boxes and figures opened before this while-looping through all double-invocations alphabetically, but this is the first worth mentioning.  A click in the figure let’s us continue.

input input

is the next one that stops us in our tracks, but we can’t actually interact with the console until we close a GUI Options dialog that’s been opened by the following.

guideopts guideopts

Close that window, enter our ‘input’ into input and we’re back on our way…after we click through the our first required dialog box.

inputdlg inputdlg

The next group is interesting because they stop us at breakpoints–quite unexpected surprises in that regard!

javaaddpath javaaddpath
javaclasspath javaclasspath
javarmpath javarmpath
publish publish

Also,

pack pack
questdlg questdlg
tsnewevent tsnewevent
uigetdir uigetdir
uigetfile uigetfile
uiopen uiopen
uiputfile uiputfile
uisetcolor uisetcolor
uisetfont uisetfont

required a click somewhere, and then we’re home free until we start over again looking at triple-invocations and more break points in

dbstop dbstop dbstop
inputdlg inputdlg inputdlg

and the Java path tools.  My favorite is coming up, which will continue to work for all number of invocations:

menu menu menu

from which we have to select a valid menu item from the “menu” menu, which in this case will be ‘menu’.

A question dialog will get us yet again, and forever it seems, as will tsnewevent and the ui functions along with some others that only work with an even number of inputs.  But, after closing enough dialog boxes and continuing through enough break points, at 10 invocations we’ve converged a bit on behavior and can look at some population results.

First, there are some funny ones based on their console output that should be included as honorable mentions:

ndgrid
numel
str2mat
strcat
strvcat
tsParseBufferStr
type
vertcat

But what we really want to look at is how many functions can be called how many times.  And also, how many functions have their maximum-allowable amount of invocations at any given count. 

invocations

So what are these cool functions that have a finite limit to their valid invocation count and aren’t already talked about here?  Highlights are:

cov cov cov
dot dot dot
kron kron kron
(l|ml|mr|r)divide (l|ml|mr|r)ldivide(l|ml|mr|r)ldivide
union union union
sparse sparse sparse sparse
spline spline spline spline
pde pde pde pde pde
polyval polyval polyval polyval polyval

and the rest appear to be arg checking, dialog boxes, and those that you can keep invoking forever.  I’m sure there are others in the list that I haven’t identified as interesting, so you should look at the list here and try running the code yourself in some later version of MATLAB.

OH!  I almost forgot to include the list of dangerous functions.  These either combinatorially exploded, corrupted the MATLAB path, or even caused a segfault in later function execution!

cell
depdir
depfun
matlabpath
memmap_data_handle_holder
path
spinmap
rjr

Well, there you have it.  An non-exhaustive description of an exhaustive enumeration of MATLAB functions and their various methods of self-invoking.  Thanks, Nick Higham, for the inspiration!

Before there were three

June 1, 2016

Almost a year has passed since the hours before I became a father.  A parent.  A Pops.  What comprises that year?

Surely 365 calendar days, the most important thing between birthdays–rather, between the birth day and its anniversary.  Or should we wait the extra day because this first year was a leap year?  Or should we wait the extra 6 hours to make sure the Sun is in the same place in the sky?  Or should we wait the extra 20 minutes to make sure the Earth is in the same place for any and every thing around those fixed stars watching us?

The 52 weeks it was, a couple days ago, that lined up with the weekend when I was still a singlet of a couple bleeding into the week when we became a trio–that seems an important count.  Or maybe it’s those first weeks and weekly days that I stay home in order to shepherd my little one into this loud, dry, cold, bright world.  Or maybe it’s all of the hours spent awake–daylight or otherwise–loving, worrying, caring, and feeling and trying and failing at so many fresh and strong things.

Twelve teeth later; 6 to 8 unassisted steps later; many inches of hair, fingernails, and height later; many pounds later; countless smiles and tears later I find myself stealing more than just a couple minutes to jot down these thoughts so I can share them.  Because I am a parent now, and so is my spouse.  And it’s very special, and I love it.  And every day things change a little, and from month to month you can see the big differences.  But that bifurcation–when one becomes two, and when two become three–is so emblematically and simultaneously a singular moment as well as this long, arduous, and powerful journey together that it’s worth taking pause, taking note.  Taking at least a single moment now to feel the memories of those single moments then.

Happy Birthday, little one.

Something like…coming out

February 25, 2016

I am a parent.  I am queer, at least.  I am a mathematician.  I am an atheist.  I am white.  I am male–of center at least.  I am Jewish.  I am afraid.  I am weak.  I am not special.  I am human.  I am 5’11”.

I feel like I have to say these things because the person that exists out there is different from the person in my body.  The person that exists across the table, through the screen, down the cable, and throughout the web–at the time of writing–is missing some of these assertions.

Things have recently changed quickly.  Last year (2015, 1464, 6765, 172, 2559, 4712, 4652, 1732, 3181, 2008, 5776, 2072, 1938, 5117, 12015, 1015, 1394, 1437, Heisei 27, 104, 4348, ROC 104, 2558, etcmore on that later) was full.  It will take me a long time to unpack it all.  I’ll be doing some of that here.  And because of that I just need to put this out there so that we’re all on the same page.

I’d love to be a better father.  A better partner.  A better ally.  A better writer.  A better scientist.  A better theologian.  A better philosopher.  A little bit taller.  I am practicing here with those #goals in mind.  This used to be the place to go for collectivist poetry about poop and other things gross.  I’ve made it a lot more about myself, and it will probably stay that way.  But something like…phoenix from the ashes, right?

There is obviously more to say about all this.  I’ve had a lot of things on my mind lately.  Now that we’ve had this talk I might share more of it here soon.

Losing Weight with … Graph Algorithms!?

June 16, 2014

weightOverTheLastYear

Contents

Problem Statement

Between the Septembers of 2009 and 2010 I participated in an incentivised diet and exercise plan. My college roommate and I had both gained weight since college, and bet each other $20 every two weeks that the slope of our weight loss trajectory would be more negative than the other’s. We came out even, and each lost 30lbs.

Since then, I’ve kept the weight off, but not without the same kind of tracking that helped me get there. I now use the Withings Smart Body Analyzer to upload my weight readings to the cloud and track my trends.

This didn’t exist for me in 2009, though, and I was taking down all my weigh-ins manually. I lost some of this data, and recently found their only relic: a JPG with the data plotted with appropriate axes.

How could I programmatically extract the data from the picture, to recreate the raw data they represented, so I could upload it to my new, snazzy Withings profile?

Just like last time we surprisingly (or not?) get to use dmperm!

Load the file

I made the picture public back then to gloat about my progress.

I = imread('https://dl.dropboxusercontent.com/u/5355654/weightOverTheLastYear.jpg');
image(I); axis equal tight
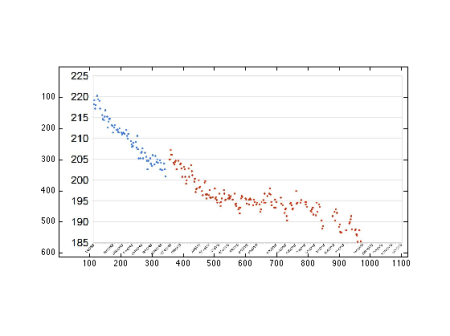
weight_01

image(I); axis equal tight, xlim([80,180]); ylim([80,180]);

weight_02

Prepare the image

We can split out the different color channels and create a sz variable for later …

R = I(:,:,1); G = I(:,:,2); B = I(:,:,3); sz = size(R);

… as well as crop out the axes …

R(571:end,:) = 255; R(:,1:100) = 255;
G(571:end,:) = 255; G(:,1:100) = 255;
B(571:end,:) = 255; B(:,1:100) = 255;

… and check out a kind of grayscale version of the image:

D = sqrt(double(R).^2 + double(G).^2 + double(B).^2);
imagesc(D); axis equal tight; colorbar; colormap bone;

weight_03

imagesc(D); axis equal tight, xlim([80,180]); ylim([80,180])
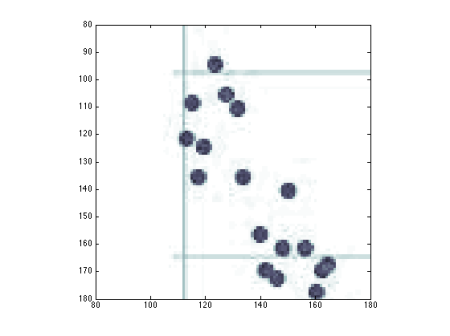
weight_04

Detect the blobs

You can do blob detection on your own in MATLAB in a cinch / pinch. We first make a Gaussian kernel, and convolve it with our image to find help localize information packets that are about the size of our kernel:

k = @(x,y,t) 1 / (2*pi*t^2) * exp(- (x.^2+y.^2) / (2*t^2) );
[x,y] = meshgrid(-8:8,-8:8);
L = conv2(D,k(x,y,1),'same');
imagesc(L); axis equal tight; colorbar

weight_05

imagesc(L); axis equal tight, xlim([80,180]); ylim([80,180]);


weight_06Then we take the laplacian, the sum of the second derivatives in both dimenions which helps us find the edges of these blobs. This assigns the appropriate sign to the data that is close in shape to our kernel. We do some mild trickery to keep the image the same size as the original:

zh = zeros(1,sz(2));
zv = zeros(sz(1),1);
L2 = [zh ; diff(L,2,1) ; zh] + [zv diff(L,2,2) zv];
imagesc(L2); axis equal tight; colorbar

weight_07

imagesc(L2); axis equal tight, xlim([80,180]); ylim([80,180]);

weight_08

Adjacency matrices?

So we have “detected” our blobs, but we still need to find out where they are in the image. We do this by thresholding our laplacian data to find out the index locations in our matrix of every pixel that matters to us. We can then build an adjacency matrix. All of the pixels we care about are “connected” to themselves in this matrix. We also can take a look at all of the pixels above, below, to the left, and to the right of our pixels of interest to see if they are thresholded out of our interest or not. We make the matrix, A, sparse because it is HUGE and we know that many of it’s entries will be zero. Why store almost half a trillion zeros?!

T = L2 > 35;
spsz = [numel(T),numel(T)];
A = logical(sparse(spsz(1),spsz(2)));

idx = find(T);
[r,c] = ind2sub(sz,idx);

A(sub2ind(spsz,idx,idx)) = 1;
A(sub2ind(spsz,idx,sub2ind(sz,r+1,c))) = T(sub2ind(sz,r+1,c));
A(sub2ind(spsz,idx,sub2ind(sz,r-1,c))) = T(sub2ind(sz,r-1,c));
A(sub2ind(spsz,idx,sub2ind(sz,r,c+1))) = T(sub2ind(sz,r,c+1));
A(sub2ind(spsz,idx,sub2ind(sz,r,c-1))) = T(sub2ind(sz,r,c-1));

Learn about the blobs

DMPERM to the rescue–we’ve made an adjacency matrix where the connected components are the blobs we care about! When we run it, we can look at each connected component, find the pixels that belong to, and average their locations. You can see each connected component and the “location” we’ve assigned each one. It’s not perfect, but it’s really close:

C = zeros(size(T));
[p,q,r,s] = dmperm(A);
n = numel(r)-1;
px = nan(n-2,1);
py = nan(n-2,1);
for> G=2:n-1
    idx = p(r(G):r(G+1)-1);
    [rows,cols] = ind2sub(sz,idx);
    py(G-1) = mean(rows);
    px(G-1) = mean(cols);
    C(idx) = .25;
end
C(sub2ind(sz,round(py),round(px))) = 1;
imagesc(C); axis equal tight; colorbar

weight_09

imagesc(C); axis equal tight, xlim([80,180]); ylim([80,180]);

weight_10

Extract the real data

With all of that work done, we can prescribe how the pixel locations relate to weights and dates, and actually collect the real data from the image:

weights = interp1(30.5:67:566.5,225:-5:185,py);
dates = interp1([112,1097],[datenum('9-8-2009'),datenum('12-1-2010')],px);

dateStrs = datestr(dates,'yyyy-mm-dd HH:MM:SS');

f = fopen('weight.csv','w');
fprintf(f,'Date, Weight\n');
D = 1:numel(weights)
    fprintf(f,'%s, %f\n',dateStrs(D,:),weights(D));
end
fclose(f);

plot(dates,weights,'.','MarkerSize',10), datetick

weight_11

All in all, this is a pretty gross way to get at the underlying data, but it was fun to try and to get it working. What have you used DMPERM for recently? What have you used MATLAB or Image Processing for recently?

Conference Scheduling with Graph Algorithms

May 6, 2014

Contents

Problem Statement

The Harvey Mudd Clinic Program has been a model for programs like it across the globe. In it, student teams are connected with corporate sponsors to define, design, and provide solutions to real world engineering problems.

Projects Day, at the end of every academic year, is when these teams and all of the corporate sponsors and friends of the HMC Community get together to celebrate Clinic and hear talks about each of the projects from that year.

Like most conferences, there is too much to see. Thankfully, each team gives their talk three times in the afternoon. The question is, how can we figure out when to go to which talk?

Preliminary Design

MATLAB can help us here. Let’s pick the 6 talks we want to go see:

  • 1:30, 2:00, & 4:00 – eSolar
  • 1:30, 2:30, & 3:30 – City of Hope
  • 2:00, 3:30, & 4:00 – HMC Online
  • 1:30, 2:00, & 4:30 – Lawrence Berkeley National Labs
  • 2:00, 2:30, & 4:00 – Walt Disney
  • 2:30, 3:00, & 4:00 – Sandia National Labs

We can make a matrix with topics as rows, times as columns, and ones where a talk is actually given at that time:

%	1:30	2:00	2:30	3:30	4:00	4:30
A = [ ...
	1	1	0	0	1	0 ; ... eSolar
	1	0	1	1	0	0 ; ... City of Hope
	0	1	0	1	1	0 ; ... HMC Online
	1	1	0	0	0	1 ; ... Lawrence Berkeley National Labs
	0	1	1	0	1	0 ; ... Walt Disney Animation Studios
	0	0	1	1	1	0]; ... Sandia National Labs

Now we know when we can go to all of the talks we want to go to. What we want, though, is to transform A into a matrix B that only has one entry in each row and column. This would be our selection. How can we do this in a way guaranteed to maximize the amount of talks we can attend while arbitrating conflicts?

Bipartite Graphs

Here, the matrices A and B that we are talking about are adjacency matrices: matrices that represent which elements of the two sets (rows and columns) are adjacent to one another (connected) in a graph. Because are rows and columns are distinct sets (in our case topics and times) the graphs we can describe are bipartite graphs: a graph on two sets where edges only connect one set to another. That is, there are no edges between topics and no edges between times. There are only edges connecting a topic to a time.

A is a bipartite graph of all of the talks that exist in the set of talks that we want to go see. B will be a subgraph of that, which connects at most each topic to one and only one time. It may be the case that there is an unresolveable conflict, in which case we will only be able to go to, say, 4 or 5 of the 6 talks we want to go to. hopeful that won’t happen.

The Dulmage-Mendelsohn Decomposition

There are many algorithms out there that feel like they are magic, and this is one of them.

The Dulmage-Mendelsohn Decomposition (or permutation) is briefly documented in MATLAB’s dmperm, and more thoroughly described (and defined) in the 1958 classic “Coverings of Bipartite Graphs” by A. L. Dulmage and N. S. Mendelsohn.

I love the details and genius in the paper, which can be a little exhausting, but the idea is that all bipartite graphs, full of edges or only with very few edges, may be made of strongly connected, connected, and/or disconnected components with respect to one of the sets. We should be able to traverse the graph in a particular way to determine which edges are in which category, and then to label them in some way for further analysis. dmperm does just that:

[p,q] = dmperm(A)

p =

     4     1     3     2     6     5

q =

     6     1     2     3     4     5

Here, p and q tell use how to reorder the rows and columns to give us, visually, the block structure of these components. In our case, we have a single, well-determined component (the other outputs of dmperm tell us this). Further, that component gets organized into the strongly connected components.

Looking at the permuted matrix:

A(p,q)

ans =

     1     1     1     0     0     0
     0     1     1     0     0     1
     0     0     1     0     1     1
     0     1     0     1     1     0
     0     0     0     1     1     1
     0     0     1     1     0     1

we see the block upper-triangular form that A has been put into. In this case, however, we only have two blocks of sizes 1×1 and 5×5 along the diagonals. Most notably for our application, we see that there are ones in every diagonal element. This means that we can go to every talk we wanted! Can you see why?

Making our Schedule

Let’s prepare our B matrix by filling it with zeros. If we then index into B using our permutation vectors from dmperm, we can tell the permutation of B to be the 6×6 identity matrix (one and only one topic per time for all times). In B, then, will be in the inverse permutation of the 6×6 identity matrix, telling us with respect to our original talk and time ordering when we should be where!

B = zeros(6);
B(p,q) = eye(6)

B =

     1     0     0     0     0     0
     0     0     1     0     0     0
     0     1     0     0     0     0
     0     0     0     0     0     1
     0     0     0     0     1     0
     0     0     0     1     0     0

Another way to think about the permutations of rows and columns is just to look at the sets of graph

topics = {'eSolar';'City of Hope';'HMC Online';'LBNL';'Disney';'SNL'};
times = {'1:30';'2:00';'2:30';'3:30';'4:00';'4:30'};
sortrows([times(q) topics(p)])

ans = 

    '1:30'    'eSolar'
    '2:00'    'HMC Online'
    '2:30'    'City of Hope'
    '3:30'    'SNL'
    '4:00'    'Disney'
    '4:30'    'LBNL'        

to get our schedule. Can you see how this matches up with our matrix B?

References

Computer Poetry? Oh 01101110 01101111 01100101 01110100 01110010 01111001!

February 28, 2014

Computer poetry isn’t bad poetry. In fact, it’s not even un-human in many cases:

There’s some amazing poetry on the linked to site, botpoet.com, and I encourage you to check it out.

Can you write a program to create a human-like poem? Can you write a poem that’s totally computer-like? Put your attempts in the comments!

%   Created by David A. Gross. Copyright 2014.

T = 15;    B = 5;    L = 10;
enjamb = toeplitz(1:(T+2*B),(T+2*B+1):-1:2)';
enjamb = enjamb(randi(10,T+2*B,1),:);
A = [ repmat(' ',L,B) ...
      reshape(char(randi(255,L*T,1)),L,T) ...
      repmat(' ',L,B)];
A(end+1,:) = [repmat(' ',1,T+2*B-13) ' said the cat'];
A(sub2ind( ...
    [L+1,T+2*B], ...
    repmat((1:L+1)',1,T+2*B), ...
    enjamb(1:L+1,:)))

gives us:

          ñ          2s˜]ŸÊUK²]2©
          Pb          \caRRH_Y¡ô
          t          W[L‹Nžç{mڅõK
                …yþ!¸rÚg€ÞÍÐ?
          Ì          D—rŸŽR¹ƒ¬¿-+Å
          ý          ×JA}1¥ŒD©¨ëë
                –ِWhò+uÝßÚCE
                    õû–©˜¤?ç§ö˜jê F
                 ZAB"rÄ\[%4
                  /­M
          ¬#ÁW²ú*áØ
                       said the cat

Enter the Rosser matrix

January 8, 2014

I love matrices. They can encode love affairs, process images — heck, things like representation theory let us use matrices for practically anything.

Rosser Matrix

I also watch Cleve Moler‘s MathWorks blog, Cleve’s Corner, like a hawk. So when he recently posted about the Rosser Matrix I was left disappointed by what he didn’t talk about. The matrix itself is interesting because of its place in eigenvalue history. Eigenvalue: the word is just awesome. If it’s not comfortable for you, just think of the eigenvalues of a matrix like they are your…values. When you go out in the world, you make an impact and push things in the direction of the values you believe in, and certain values are more important to you than others. Matrices do the same thing with the (eigen)values they espouse.

So it’d be great if we could compute the eigenvalues of a matrix: they tell us a lot (or at least something) about who they are. These days, this is straightforward, there are many (even free) computational tools to do it. Back in the day, however, eigenvalues were a difficult thing to find, and some were harder than others. For example, eigenvalues that are really close to one another are hard to pin down precisely, and when an eigenvalue is repeated (that’s a thing) we’d like to find every copy of it.

So, back to Rosser. He makes this test matrix in 1950 that’s got a lot of good stuff in there that they could compute exactly:

  • A double eigenvalue.
  • Three nearly equal eigenvalues.
  • Dominant eigenvalue of opposite sign.
  • A zero eigenvalue.
  • A small, nonzero eigenvalue.

Then they could benchmark proposed eigenvalue-finding-algorithms (which would run for days on behemoth computers) against how close they were to the actual eigenvalues.

I love this steampunk mathematics, but the juiciest parts seemed to be left out of Cleve’s post: what algorithms were they actually using back then and (more importantly) how does one make a test matrix? It appeared that it wasn’t just Cleve leaving out the good stuff either, MATLAB itself doesn’t tell us anything interesting about how to make the Rosser matrix:

%   Copyright 1984-2005 The MathWorks, Inc.
%   $Revision: 5.10.4.2 $  $Date: 2005/11/18 14:15:39 $

R  = [ 611.  196. -192.  407.   -8.  -52.  -49.   29.
       196.  899.  113. -192.  -71.  -43.   -8.  -44.
      -192.  113.  899.  196.   61.   49.    8.   52.
       407. -192.  196.  611.    8.   44.   59.  -23.
        -8.  -71.   61.    8.  411. -599.  208.  208.
       -52.  -43.   49.   44. -599.  411.  208.  208.
       -49.   -8.    8.   59.  208.  208.   99. -911.
        29.  -44.   52.  -23.  208.  208. -911.   99.];

After more slightly digging than expected, I found Rosser’s original paper on the subject (and an incredible bible of math I hadn’t heard of before). The first thing I noticed was that there were many other people involved than just Rosser, none of which were slouches: Lanczos has eponymous algorithms, Hestenes with him crushed some linear systems, and Karush killed it at nonlinear programming. Another name I saw which deserves mention here is in the footnote below:

Miss Fannie M. Gordon, numerical analyis

There’s isn’t much on the internet about Miss Gordon, but it appears she was working at INA along with Lanczos. In his paper on “his” algorithm (not yet named as such) to which the Rosser matrix paper is a direct follow-on, another footnote talks about her in much more grateful detail:

Indebted to Miss Gordon

While she didn’t go down in the record books like Lanczos and friends, it’s great to see that her work behind the scenes was appreciated and talked about, a part of mathematical history we don’t talk about now as much as we should. For another peak into this corner of the mathematical world, check out the list of all of the NBS/NIST staff members mentioned in A Century of Excellence in Measurements, Standards, and Technology: A Chronicle of Selected NBS/NIST Publications, 1901-2000 [Text, Google Books].

With all this information at my fingertips, I could get a much clearer picture of how to get your hands dirty and find an eigenvalue. It’s only in another appendix, however, that Rosser tells us how to make actually make a test matrix, the key ingredient that was used to benchmark algorithms across decades of computational and mathematical advancement. There, on the bottom of page 293, are the 64 entries of the matrix (color coded in the image above), just as they are in rosser.m:

The original Rosser matrix

I had to see how it actually worked, so in the paste below you’ll find a MATLAB Rosser recipe, the way sausage is actually made (you can skip the code for a visual explanation):

%   Created by David A. Gross. Inspired by [1].
%   Construction from [2,3].
%
%REFERENCES
%   [1] http://blogs.mathworks.com/cleve/2014/01/06/ ...
%   the-rosser-matrix/, accessed on 2014/01/07
%
%   [2] Rosser, J.B.; Lanczos, C.; Hestenes, M.R.; Karush, W.
%   Separation of close eigenvalues of a real symmetric matrix
%   (1951), J. Res. Natl. Bur. Stand., Vol. 47, No. 4, p. 291,
%   Appendix 1, https://archive.org/details/jresv47n4p291,
%   accessed on 2014/01/07
%
%   [3] T. Muir, History of Determinants III, 289 (Macmillan
%   and Co., Ltd., London, 1920), http://igm.univ-mlv.fr/ ...
%   ~al/Classiques/Muir/History_3/, accessed on 2014/01/07

% make our eigenvalues in 2x2 matrices
M1 = [102  1 ;  1 -102]; % lambda = ± sqrt(102^2 + 1)
M2 = [101  1 ;  1  101]; % lambda = 101 ± 1
M3 = [  1 10 ; 10  101]; % lambda = 51 ± sqrt(51^2-1)
M4 = [ 98 14 ; 14    2]; % lambda = 100, 0

B = zeros(8);

% explode M[1...4] into an 8x8 matrix
B([1,6],[1,6]) = M1;
B([2,8],[2,8]) = M2;
B([4,5],[4,5]) = M3;
B([3,7],[3,7]) = M4;

sylvester88_A = @(a,b,c,d) [ ...
    a  b  c  d ; ...
    b -a -d  c ; ...
    c  d -a -b ; ...
    d -c  b -a ];

sylvester44 = @(a,b,c,d) [ ...
    a  b  c  d ; ...
    b -a  d -c ; ...
    c -d -a  b ; ...
    d  c -b -a ];

% make Sylvester's "penorthogonant" of determinant 10^8
P = blkdiag(sylvester88_A(2,1,1,2),sylvester44(1,-1,-2,2));

% P'*P = 10I
R = P'*B*P;

It’s quite cool, actually. Four 2×2 symmetric matrices are constructed to have the desired eigenvalues, and those matrices are exploded into an 8×8 sparse matrix (sparse in that it’s all zeros where there aren’t any dots):

How the sausage matrix gets made

Lastly, a special matrix (magenta & yellow, above) is smashed on either side of our sparse matrix and BAM!–you’ve got yourself a full test matrix with the eigenvalues you wanted.

There’s a lot of this that’s wonderfully clear and clever, in hindsight: how Rosser forced and hand-calculated the eigenvalues he wanted, how he kept the matrix symmetric. But there are many things that were left up to Rosser to decide, almost artistically, about how the matrix should be made. The special smashing matrix, for example, actually scales up the eigenvalues of the original four matrices by a constant factor. A guy named Sylvester said that it was easy to make it scale up by powers of 2, but that if you were careful you could make a matrix that scales up by any number you want. Rosser had to cleverly find the integer entries of that special matrix that would give him a scale that meaningfully preserved the original eigenvalues he picked (for usability and clarity) and he chose to scale them up by 10.

Another artistic choice Rosser made was how to explode the original matrices into the sparse 8×8 matrix. What I mean is all of the following matrix explosions:

Matrix explosions

(and 2,511 other possibilities) have the same eigenvalues, but would make completely different full matrices after being smashed. Computational eigenvalue history would have looked very–well, slightly–different had Rosser picked any of these as the base for his test matrix. Maybe there’s something deeper to uncover here about his choices, but I’d like to think that Rosser loved matrices as much as I do, and that’s just one that he liked more than the rest.

If you don’t love matrices now, that’s ok. What originally started as a small coding exercise turned into a much deeper and richer look at the history of computational linear algebra (matrix algorithm stuff). I hope that some of you take the code and have fun making matrices that match up with your own values, and that others learned a little about how math was done almost 65 years ago.